UK House Prices Rise 1.4% Annually as of July 2026, ONS/Land Registry Data Shows
· Industry News · 1 min read · HM Land Registry / GOV.UK
Average UK house prices rose 0.7% month-on-month and 1.4% annually in July 2026, reaching £273,000. Regional divergence continues - the North East leads growth at +4.9% annually, while London remains the only region seeing prices fall, down 3.3% year-on-year.
The UK House Price Index (UK HPI) for July 2026, published by HM Land Registry, shows average house prices rose 0.7% month-on-month and 1.4% year-on-year, putting the average UK property at £273,000.
England overview
In England, prices rose 0.7% since June and are up 1.1% annually, taking the average property value to £293,000.
Regional picture:
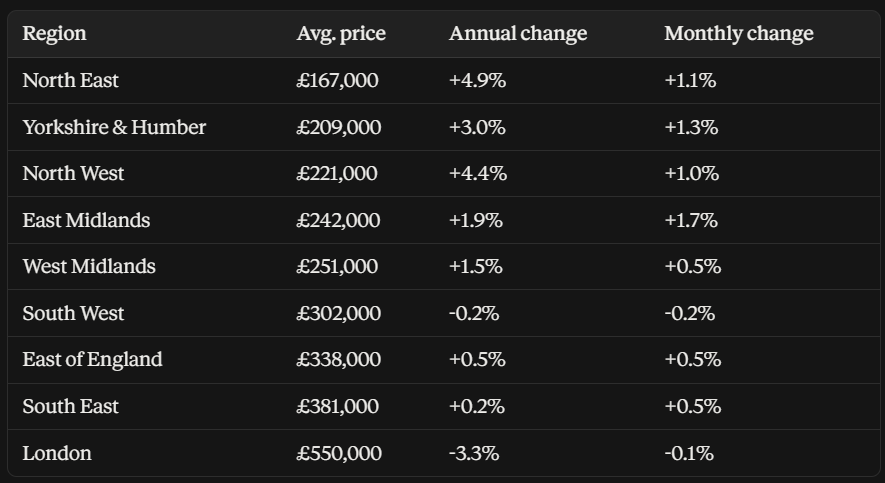
East Midlands saw the strongest monthly growth (+1.7%)
South West was the only region to see a monthly fall (-0.2%)
North East posted the strongest annual growth (+4.9%)
London was the only region to see annual prices fall (-3.3%)
Price by region (July 2026)
London
London prices fell 0.1% month-on-month and are down 3.3% annually - the weakest performance of any English region. Flats saw the steepest annual decline, down 6.6% to £424,000, while detached homes still rose 1.2%.
Wales
Wales bucked the softer trend seen in the South, with prices up 1% month-on-month and 2.6% annually, taking the average property to £215,000.
Transactions
HMRC data shows an estimated 97,000 residential property transactions of £40,000+ in July 2026 (seasonally adjusted) - down 1.1% year-on-year and down 1.7% on June.
What this means for landlords
Regional divergence remains the key story: landlords in the North East and North West are sitting on stronger capital growth, while London portfolios continue to face annual price falls, particularly for flats. Worth flagging to Proofhold users with London-based portfolios given the sharper decline there relative to houses.
Source: HM Land Registry / GOV.UK, published 16 September 2026